bymuratdeniz/E+ via Getty Images
The purpose of this article is to examine the USA sectoral flows for May 2022 and assess the likely impact on markets as we advance into June. This is pertinent, as a change in the fiscal flow rate has an approximately one-month lagged impact on asset markets and is a useful investment forecasting tool. There are other macro-fiscal flows that can point to events many months ahead.
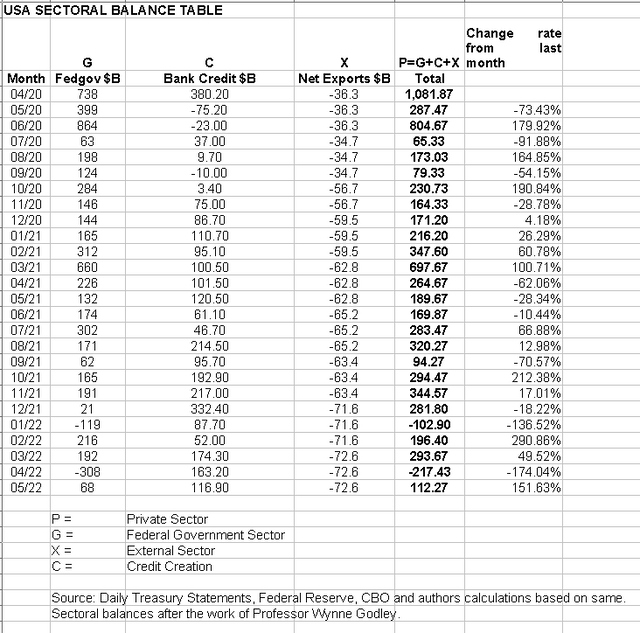
The table below shows the sectoral balances for the USA and is produced from the national accounts.

From the sectoral balances table above, we see that for May 2022, we have a positive nominal flow of $112B into the private sector and a positive change rate month over month. For markets, the change rate tends to be more important than the headline number, and in this case, both are positive and this is supportive for asset markets.
The current market plunge is part of a seasonal pattern that occurs at this time caused by the institutionalized spending and taxing pattern and made much worse by the year-on-year fiscal contraction and the feds tighter monetary stance.
The chart below shows the five-year average of the seasonal stock market patterns for the SPX (SPX), NDX (NDX), Dow (DIA), Russell 2000 (RTY), and Biotech (IBB) market indexes. The black circle shows roughly where we are [trading day 116 at the time of writing and the end of the green line on the chart below] and the general seasonal pattern now is for markets to rise into September after the middle…


