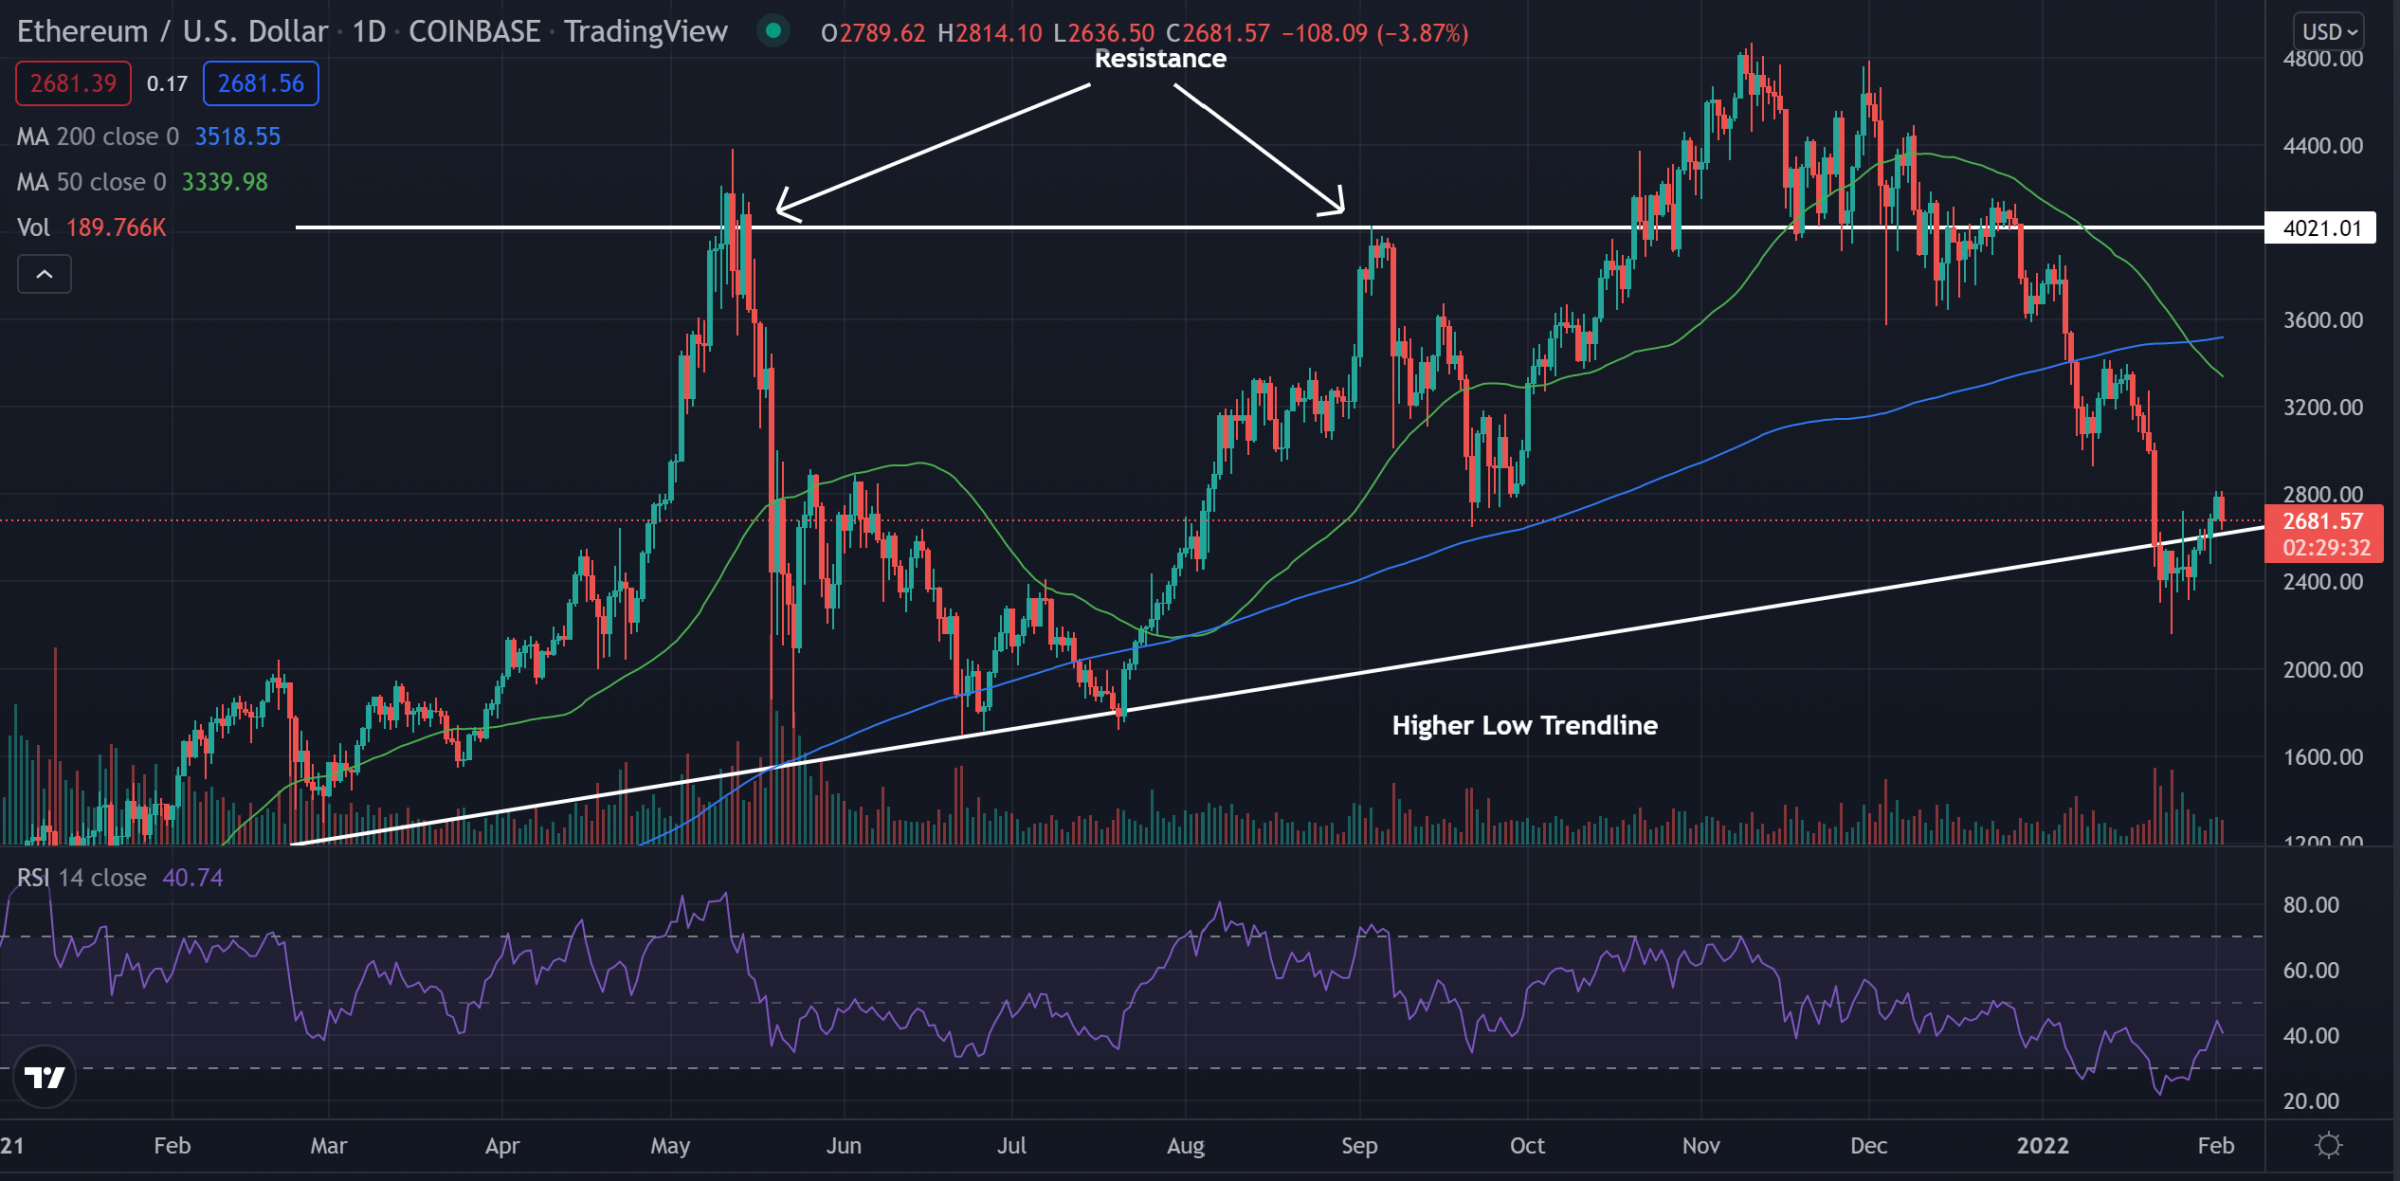
Ethereum (CRYPTO: ETH) is trading lower Wednesday, dipping toward the trendline in a pattern. The cryptocurrency market is seeing declines across the board, as most popular cryptos are trading lower. Ethereum has started to form higher lows and has seen increased volume, which is a sign that the bearish market may at the initial stage of coming to an end.
At last check, Ethereum was down 1.83% at $2,707.
See Also: Will Ethereum Keep Climbing? Overcoming These Key Levels Could End The Bear Cycle
Ethereum Daily Chart Analysis
- Ethereum has fallen below the higher low trendline in what traders call an ascending triangle pattern. This fuels uncertainty over whether the market is turning around or is seeing a period of consolidation before more bearish movement.
- The crypto trades below both the 50-day moving average (green) and the 200-day moving average (blue), indicating that Ethereum has been trading with a bearish sentiment. Each of these moving averages may hold as an area of resistance in the future.
- The Relative Strength Index (RSI) has been climbing for the past couple of weeks and now sits at 41. This is the first time the RSI reached 41 since early January. This shows that more buyers have been stepping back into the market. An uptrend could be confirmed if the RSI can hold above the midline of the indicator.

What’s Next For Ethereum?
The higher lows show a possible reversal of the recent downward trend if the crypto can continue forming higher…


