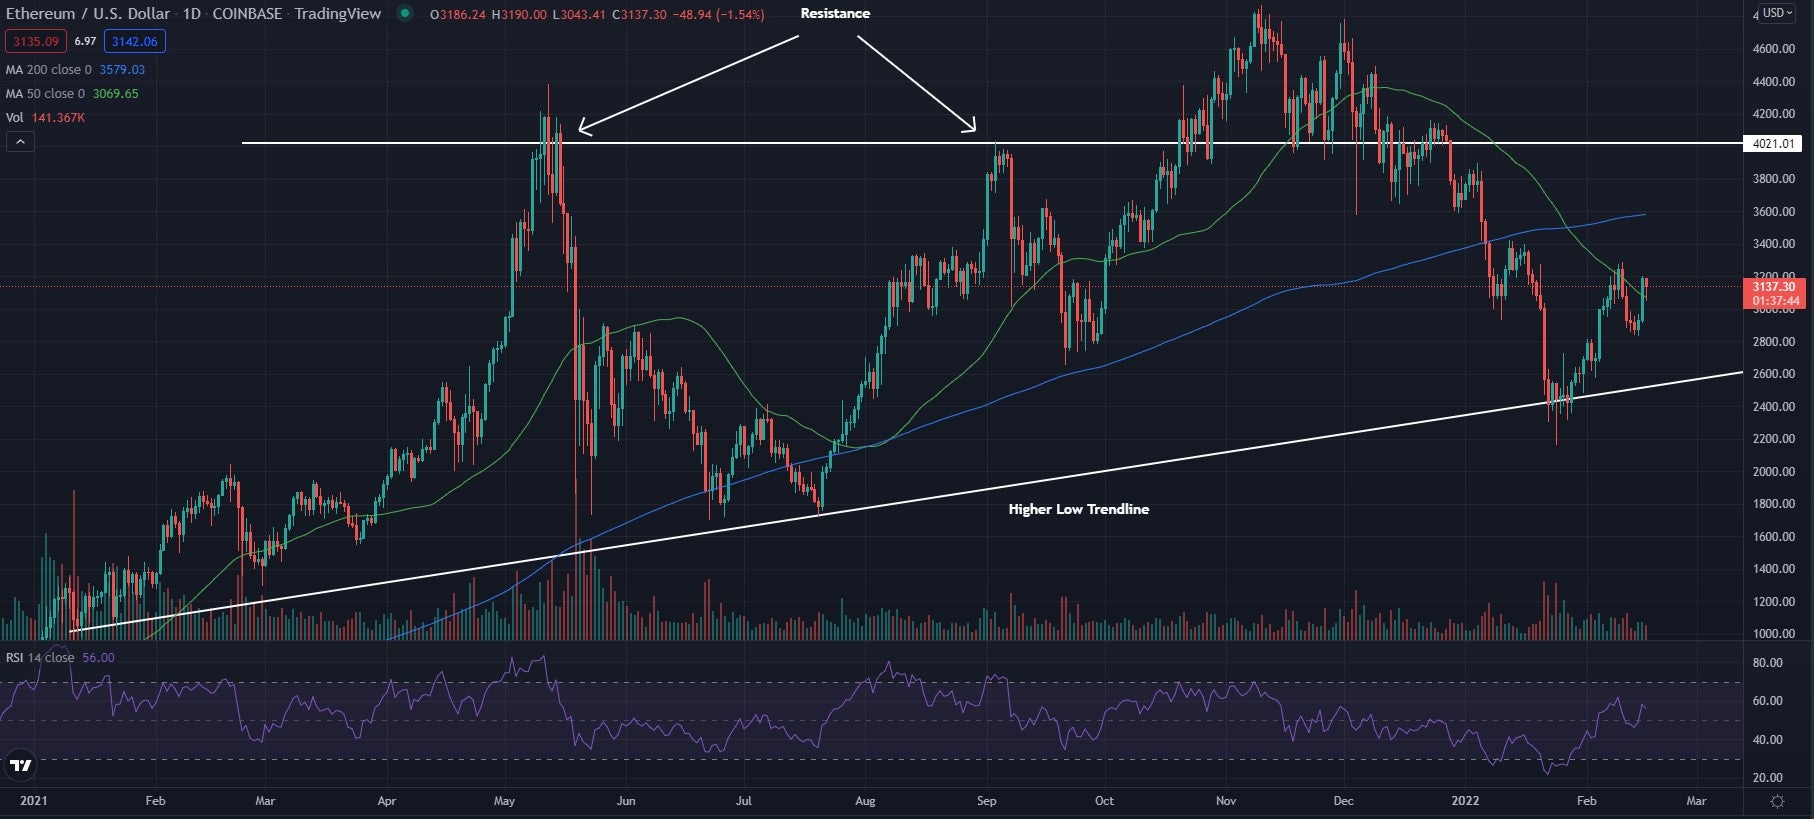
While Ethereum (CRYPTO: ETH) was trading lower most of Wednesday — cooling off after having a strong green day yesterday — the crypto took a turn in the late afternoon and is trading slightly up again. The crypto has been rebounding the past few weeks after seeing a strong bear market for a couple of months. The crypto has been nearing resistance and could see a breakout in the coming weeks if the bullish trend continues.
Ethereum was up 0.14% at $3,139.60 Wednesday at publication.
Ethereum Daily Chart Analysis
- Ethereum has been climbing for the past few weeks and now sits right between the higher low trendline and the $4,000 resistance level. The crypto forming higher lows once again is a bullish sign for it.
- The crypto trades above the 50-day moving average (green) but trades below the 200-day moving average (blue), indicating the crypto is now trading in a period of consolidation. The 50-day moving average may hold as an area of support, while the 200-day moving average may act as resistance.
- The Relative Strength Index (RSI) has been climbing for the past couple of weeks and now sits at 55. This shows the crypto has seen more buyers than sellers over the past few weeks as the price has been increasing. If the RSI can hold above the middle line it may continue to see bullish price movements.


